Your Post Table Just Got Charts: See Which Content Pillar Really Works

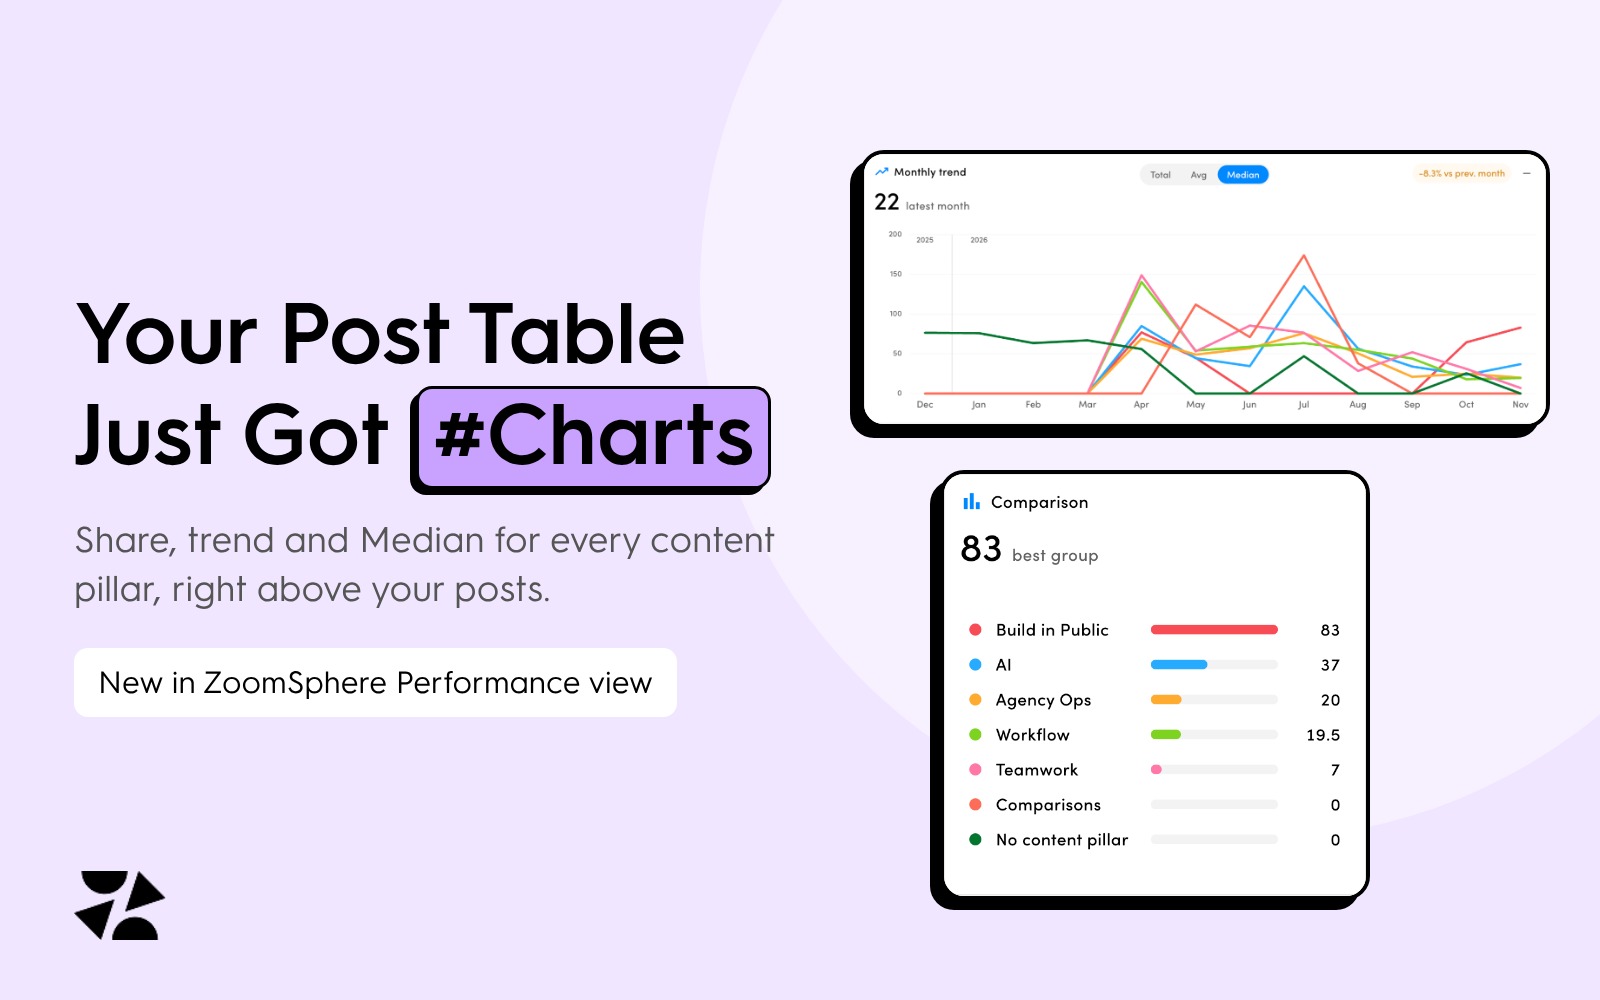
A list of posts tells you what you published. It rarely tells you what worked. You sort a column, export a CSV, build a pivot table, and half an hour later you still are not sure which topic, network or format deserves more of your time.
The new Performance view in ZoomSphere answers that question right above your post table. Two charts, a smart switch between Total, Avg and Median, grouping by content pillar, totals for every group and column presets you set up once. Here is what it is good for and exactly how to use it.
The whole release in 90 seconds. Sound on.
What you can use it for
Where to find Performance view
No new module, no setup. Performance view lives in every ZoomSphere scheduler, one click away from your calendar:
Open any scheduler, a single brand or a Global Posts calendar that pulls several workspaces together.
Click the view switch in the top right corner. It shows the view you are on right now, for example Week view.
Pick Performance view at the bottom of the list, below Day, Week, Month, Compact and List view.
Choose Group by, Metric and Total, Avg or Median. The charts and the table update instantly.
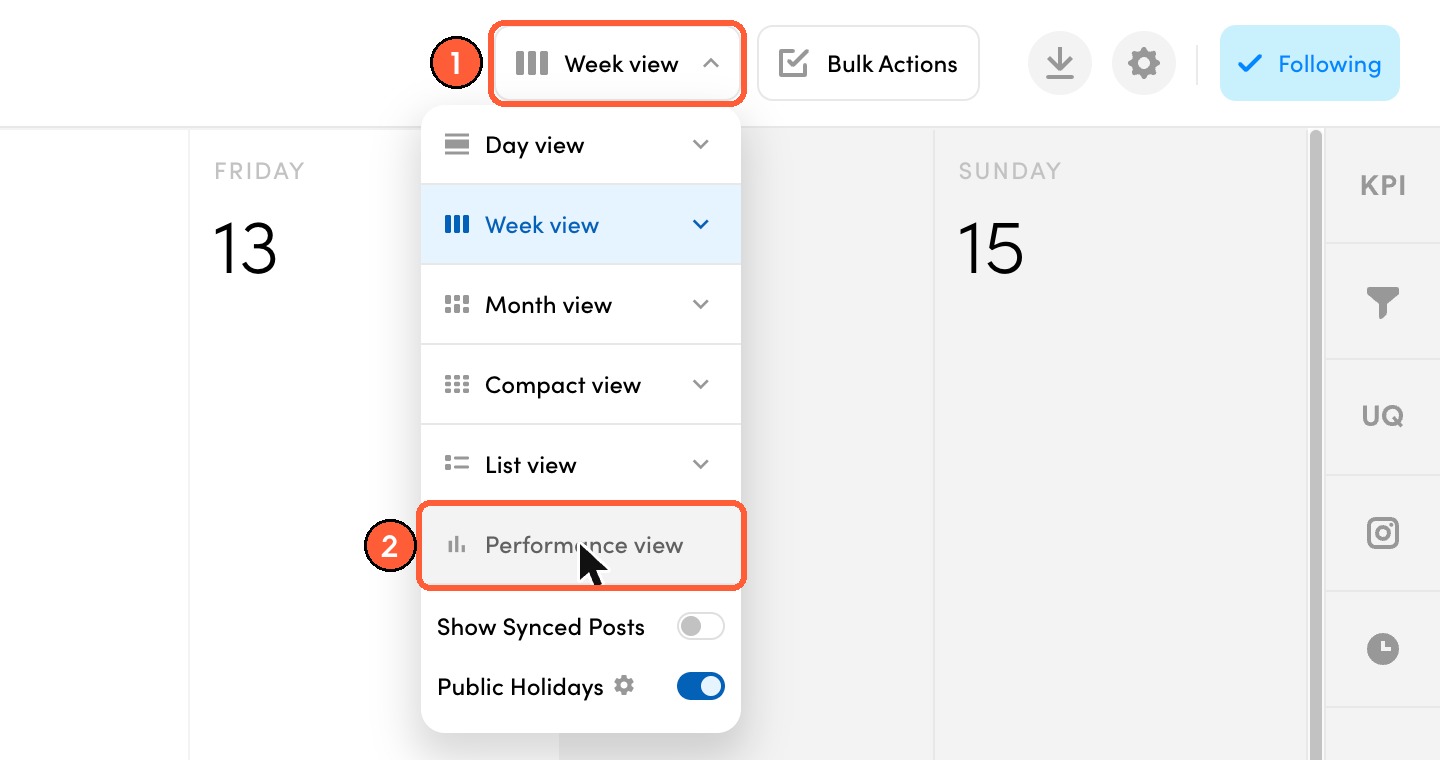
1 + 2: the view switch, then Performance view.
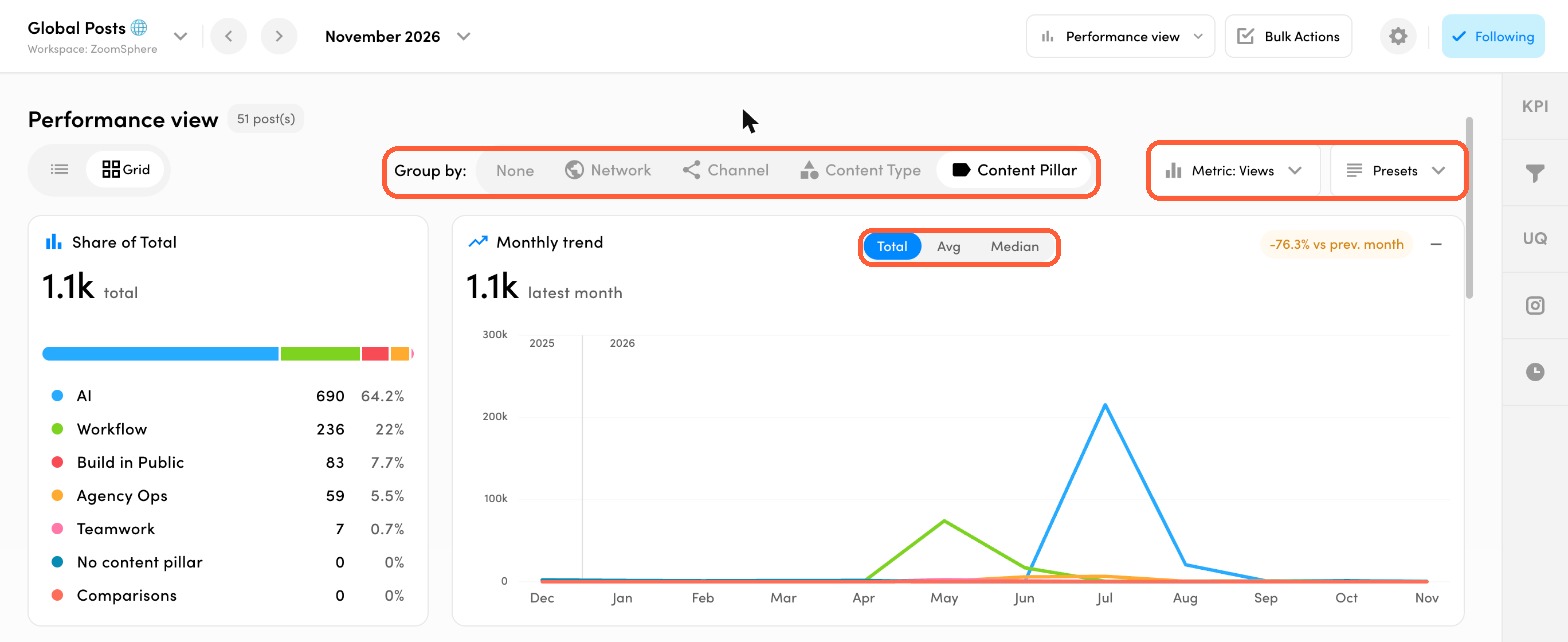
3 + 4: Group by, metric, presets and Total, Avg or Median.
How to read the two charts
Right above the post table you get two charts that always follow your current grouping and metric:
- Share of Total shows how much each group contributed in the selected month: one stacked bar plus a ranked list with values and percentages. Use it to answer "where did our results come from?"
- Monthly trend draws the last 12 months, one line per group, with the change versus the previous month in the corner. Use it to answer "is this getting better or worse?"
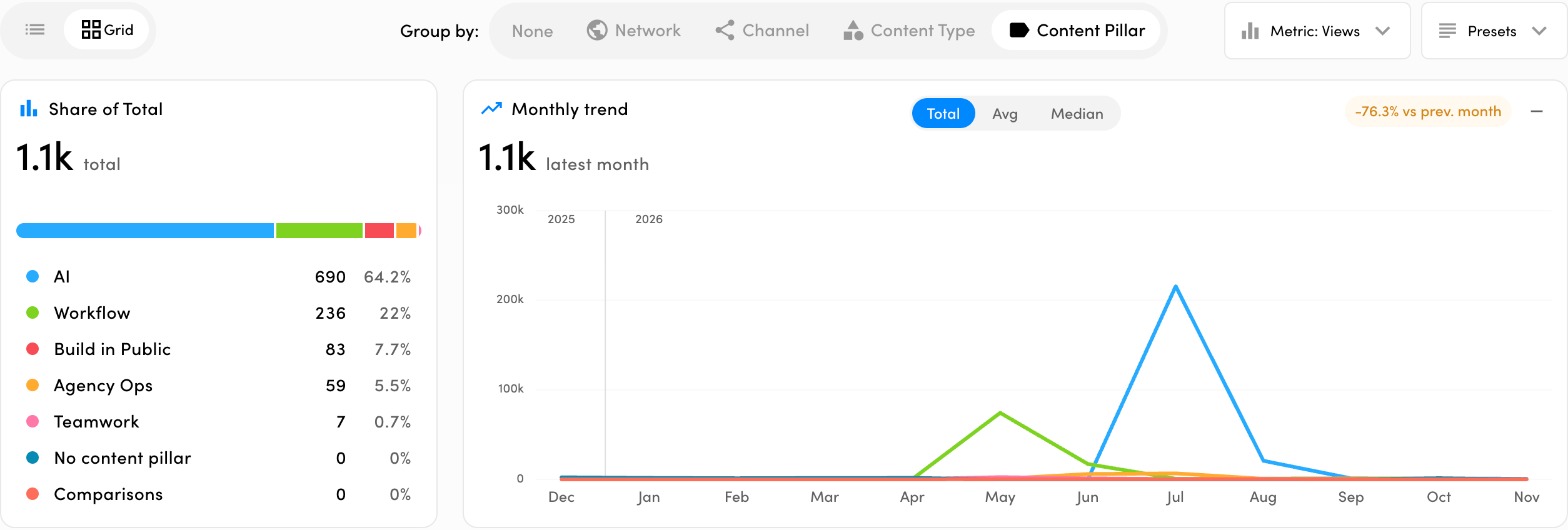
Share of Total on the left, Monthly trend on the right, the post table right below.
Group by and pick the right metric
The Group by bar decides how your posts are split. Each option answers a different question:
| Group by | Question it answers |
|---|---|
| Content Pillar | Which topics or content themes work best? Posts without a pillar land in No content pillar, a quick way to spot gaps in tagging. |
| Network | Is Instagram, LinkedIn, TikTok or Facebook pulling its weight? |
| Channel | Which specific profile or page performs best, for example per brand or per market? |
| Content Type | Do Reels, carousels, Stories or classic posts deliver more? |
| None | How is the whole calendar doing overall? |
Then open Metric and choose what to measure: Views, Video Views, Reach, Interactions, Likes, Comments, Shares or Clicks. Pick the one that matches your goal: Reach and Views for awareness, Interactions and Comments for community, Shares for content people want to pass on, Clicks for traffic.
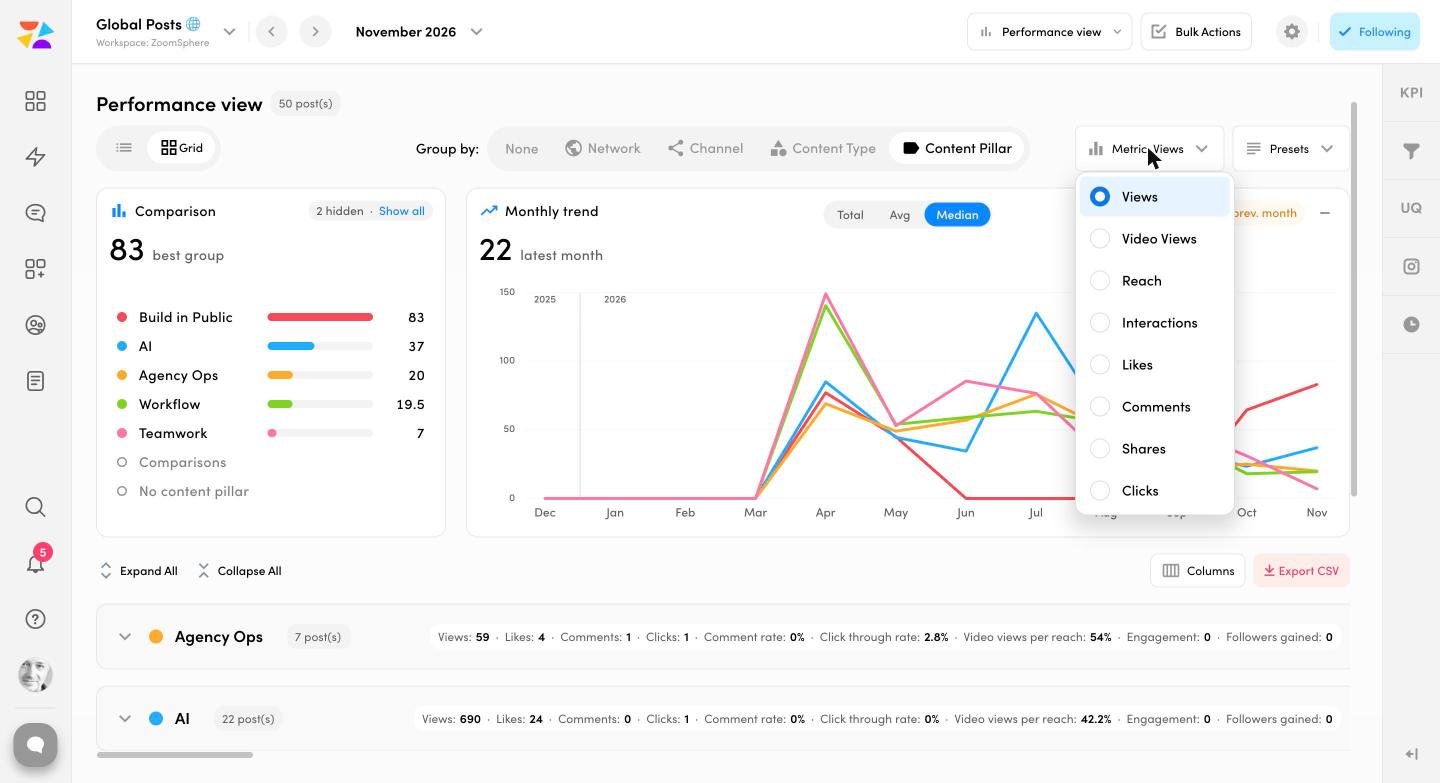
One dropdown switches both charts to a different metric.
Total, Avg or Median: which one when
The switch above the trend chart changes how posts in a group are combined. This is the single most useful click in the whole release:
| Mode | What it shows | Use it when |
|---|---|---|
| Total | Sum of all posts in the group | You want to know where the overall volume came from |
| Avg | Average per post | Groups have very different numbers of posts and you want a fair comparison |
| Median | The typical post in the group | One viral post could distort the picture and you want to see what usually happens |
Try it right here, on a real chart from our own calendar:
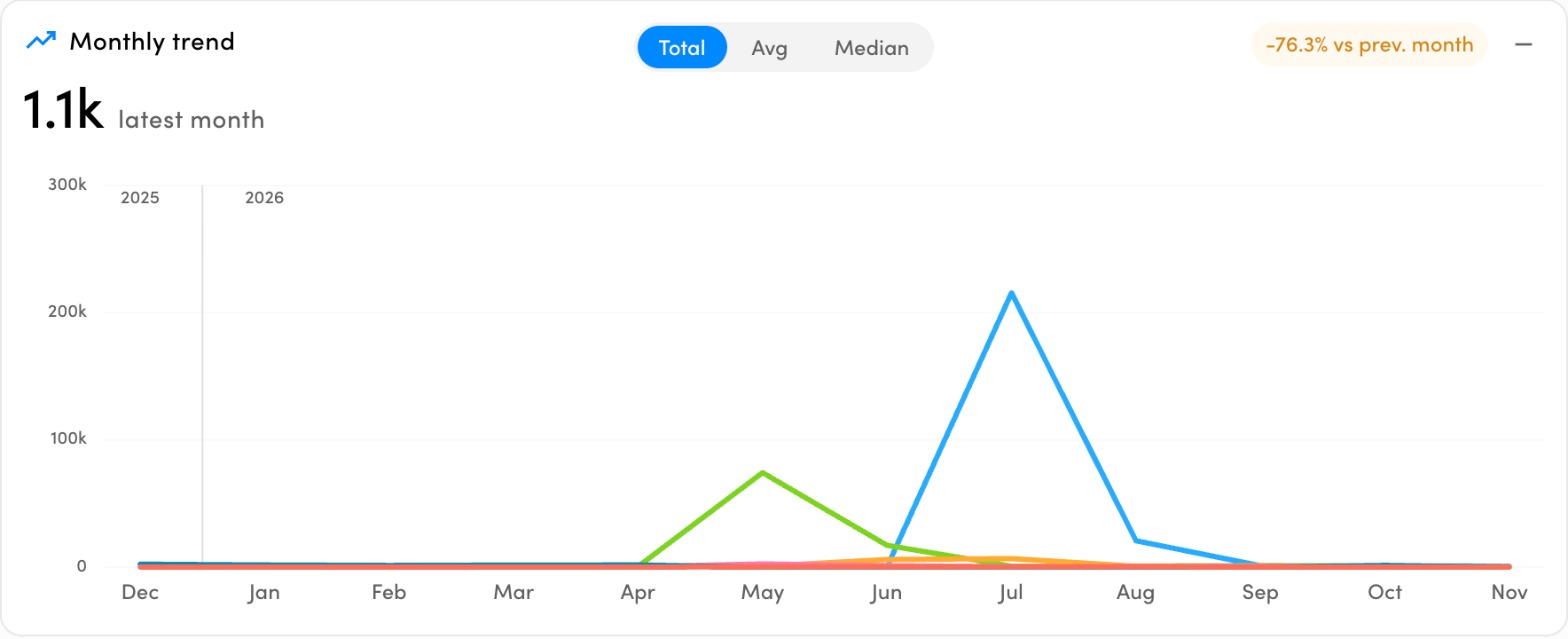
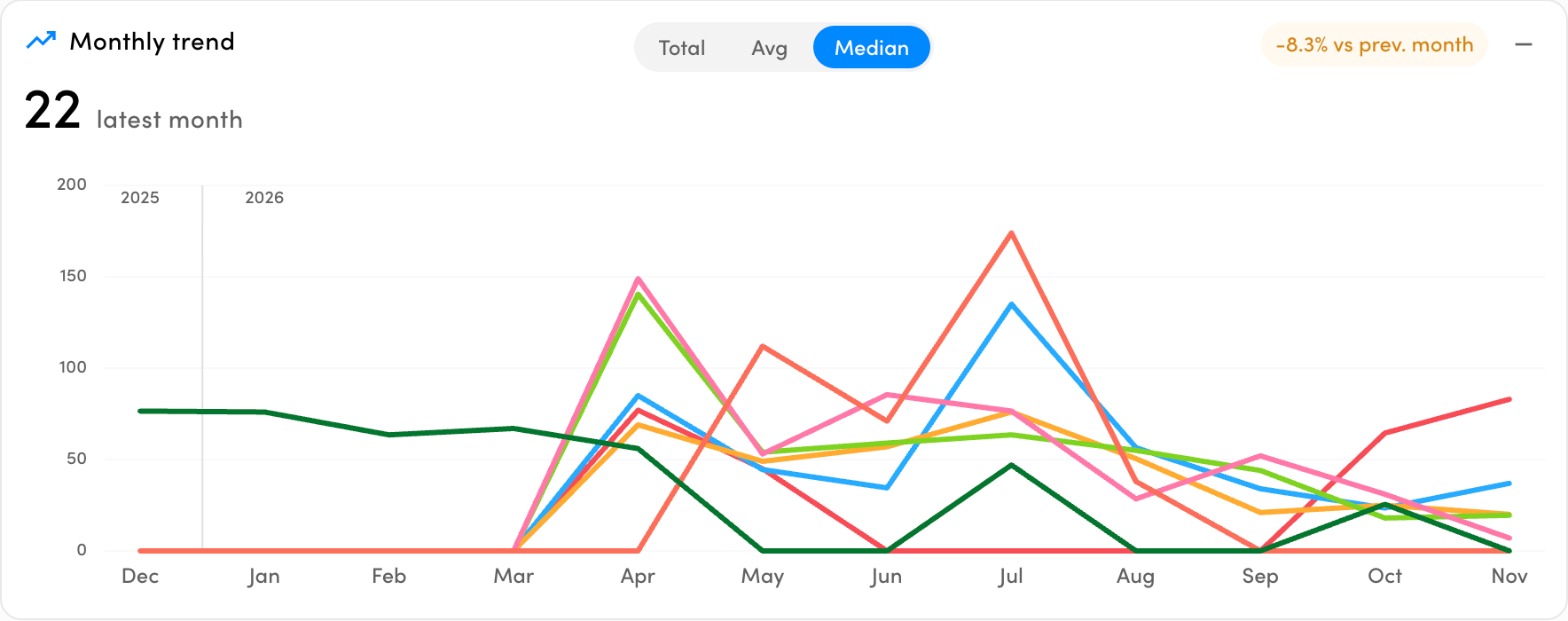
On Total one viral month flattens everything. On Median every group shows its real shape.
With Avg or Median on, the left chart turns into a Comparison that ranks your groups by the typical post. Often the group that wins on volume is not the one that wins per post, and that is exactly the insight you want before planning the next month.
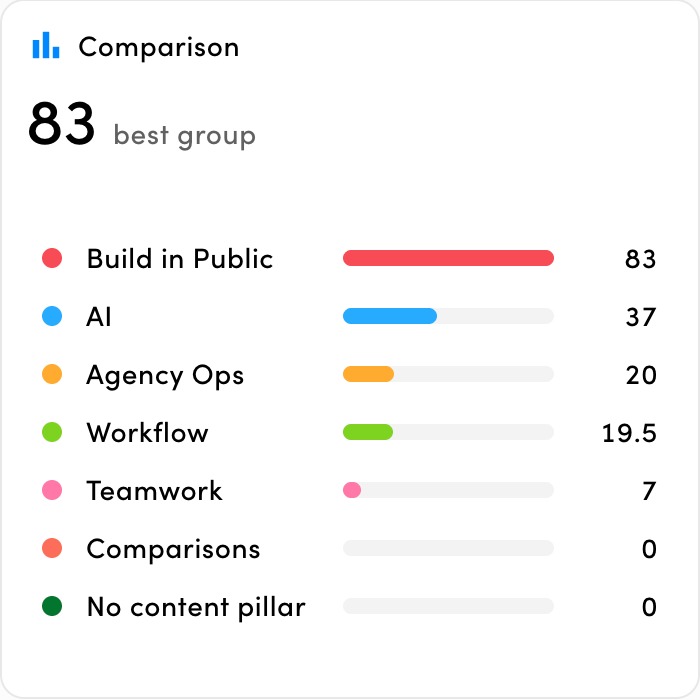
Comparison ranks groups by the typical post.
Focus the charts: hide groups and fold the panel
Click any group in the legend to hide it from both charts. Great when one big group dwarfs the rest.
Click Show all to bring every group back.
Click the minus icon in the corner of the charts to fold the whole panel away when you just want the table.
Come back any time. ZoomSphere remembers your grouping, metric, mode, hidden groups and folded panel.
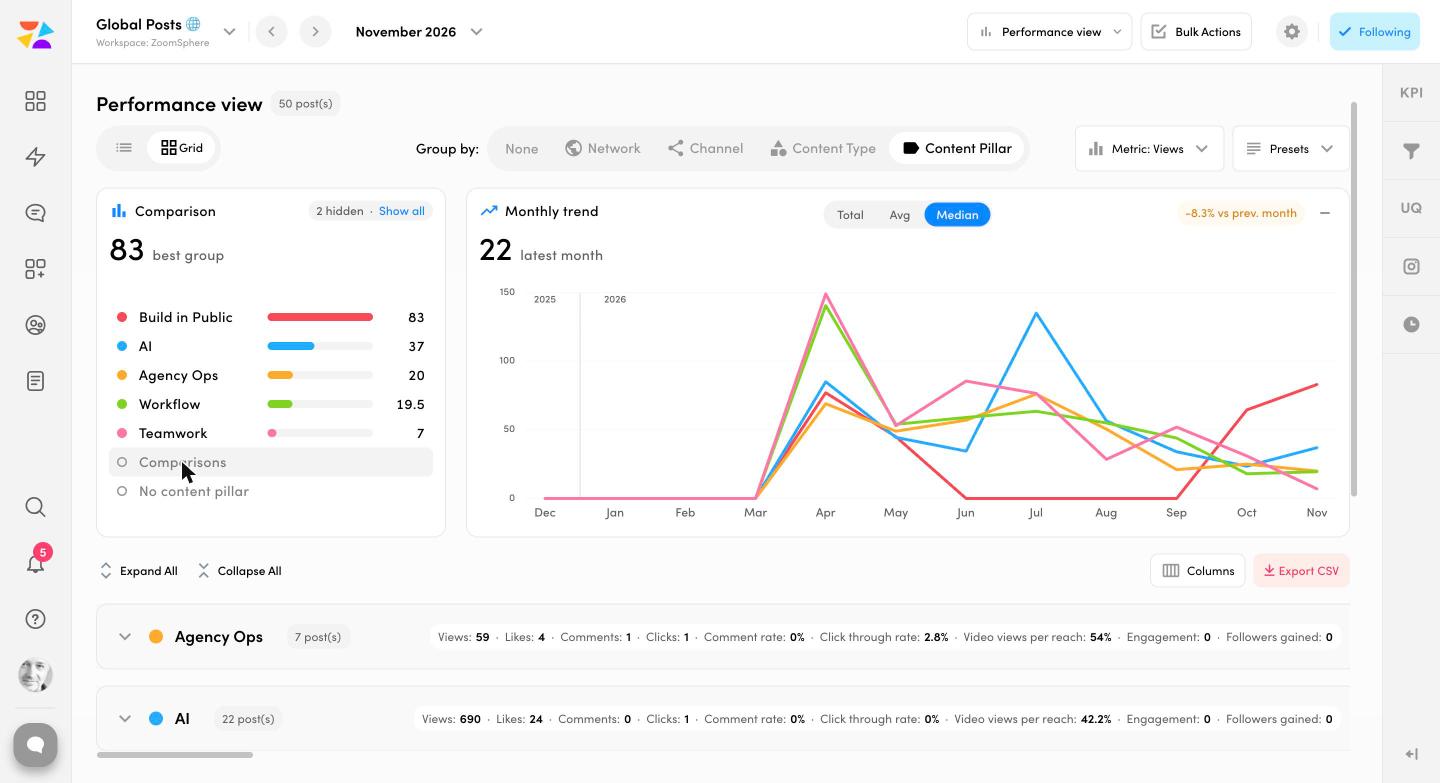
Two groups hidden, the charts rescale to the rest. Show all brings them back.
List view, Grid view and totals for every group
The charts work in both views, so pick the table that suits the job:
- List view keeps one long table of posts, ideal for scanning and sorting.
- Grid view splits the table into the same groups as your charts and adds a Total row with a SUM under every metric column. "How did LinkedIn do this month?" becomes one glance, not a calculator.
- Collapsed groups show the key numbers right next to the group name. Expand All and Collapse All open or close everything at once.
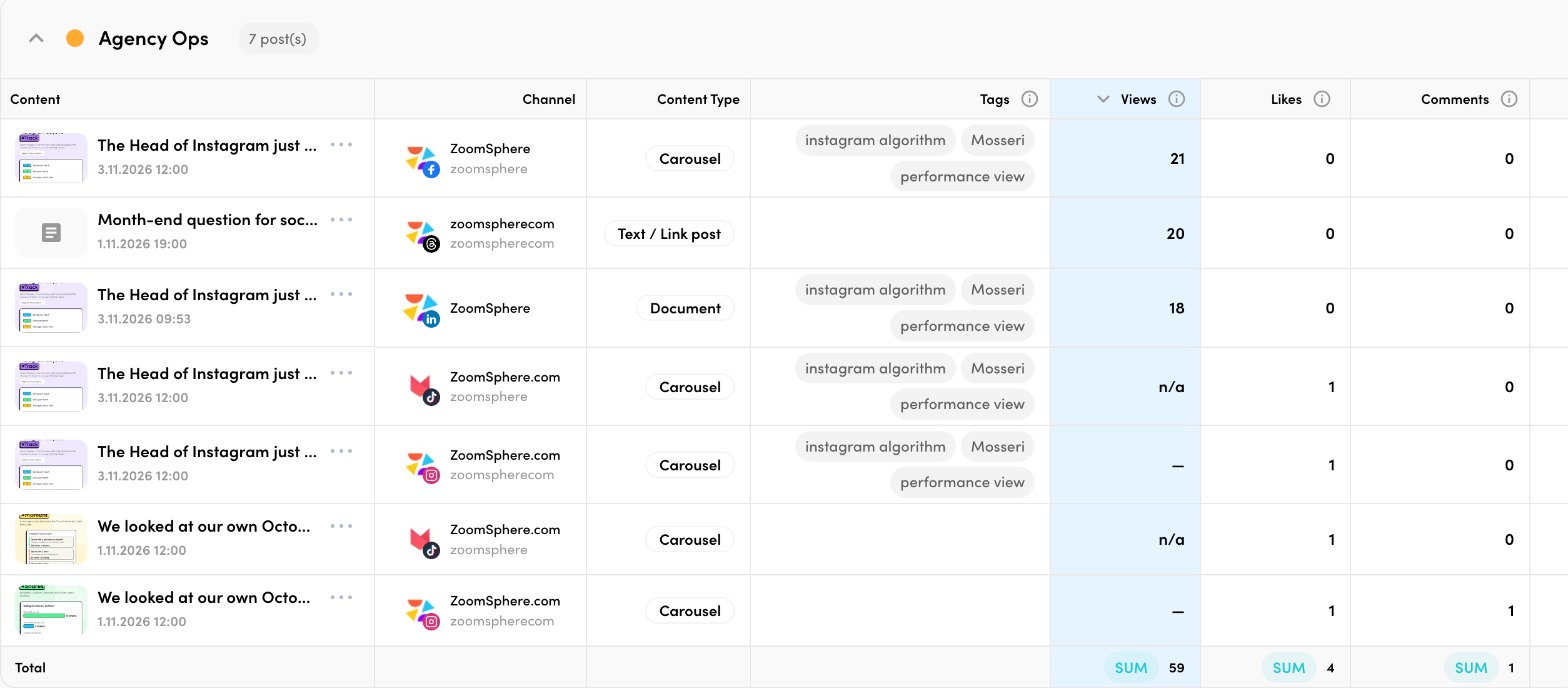
Grid view: every group gets its own Total row.
Columns, search and presets
Different content needs different numbers. A Reel needs watch time, replays and skip rate, a Story needs taps, exits and replies, a carousel needs saves and shares. Set the columns up once and switch in one click:
Click Columns under the charts and tick the metrics you want. Type into the search to find any metric fast, for example "rate" shows every rate metric with the networks that provide it.
Drag and drop columns in the table header to put them in the order you, or your client, read them.
Open Presets in the top right corner and start from a suggested set: Overview, Reels / video, Stories or Posts.
Click Create Preset to save your own combination under a name like "Monthly client report". Next time it is one click away.
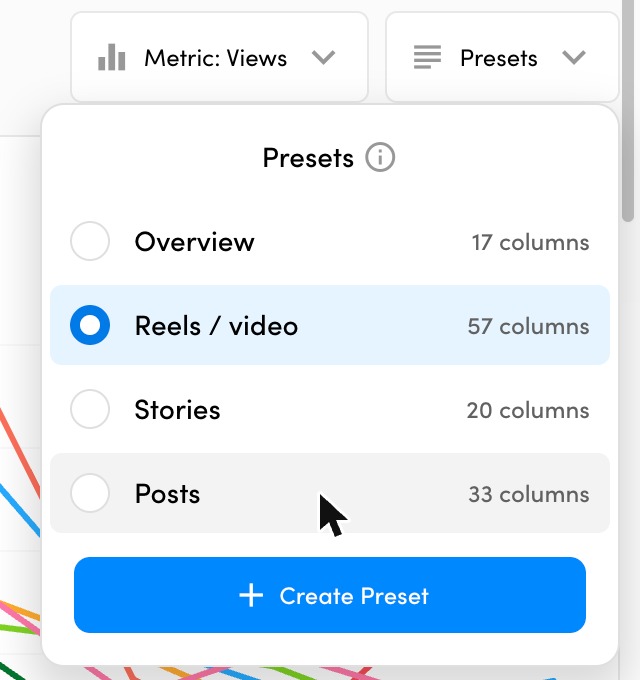
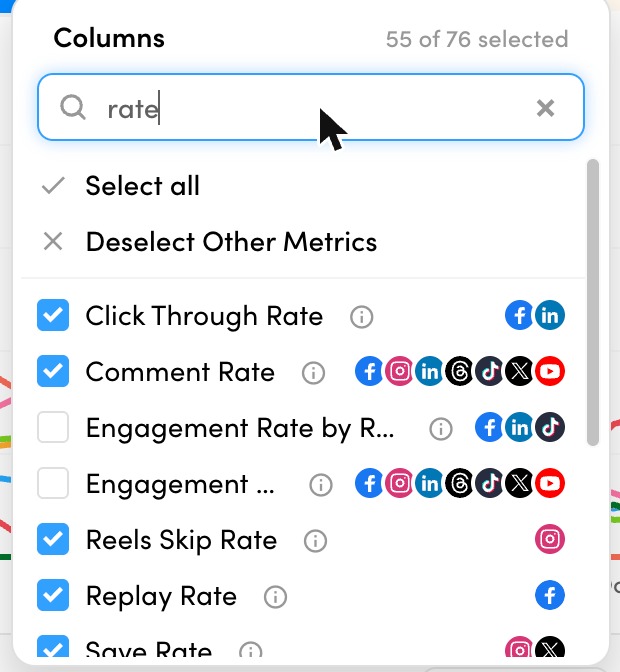
Suggested presets on the left, column search on the right.
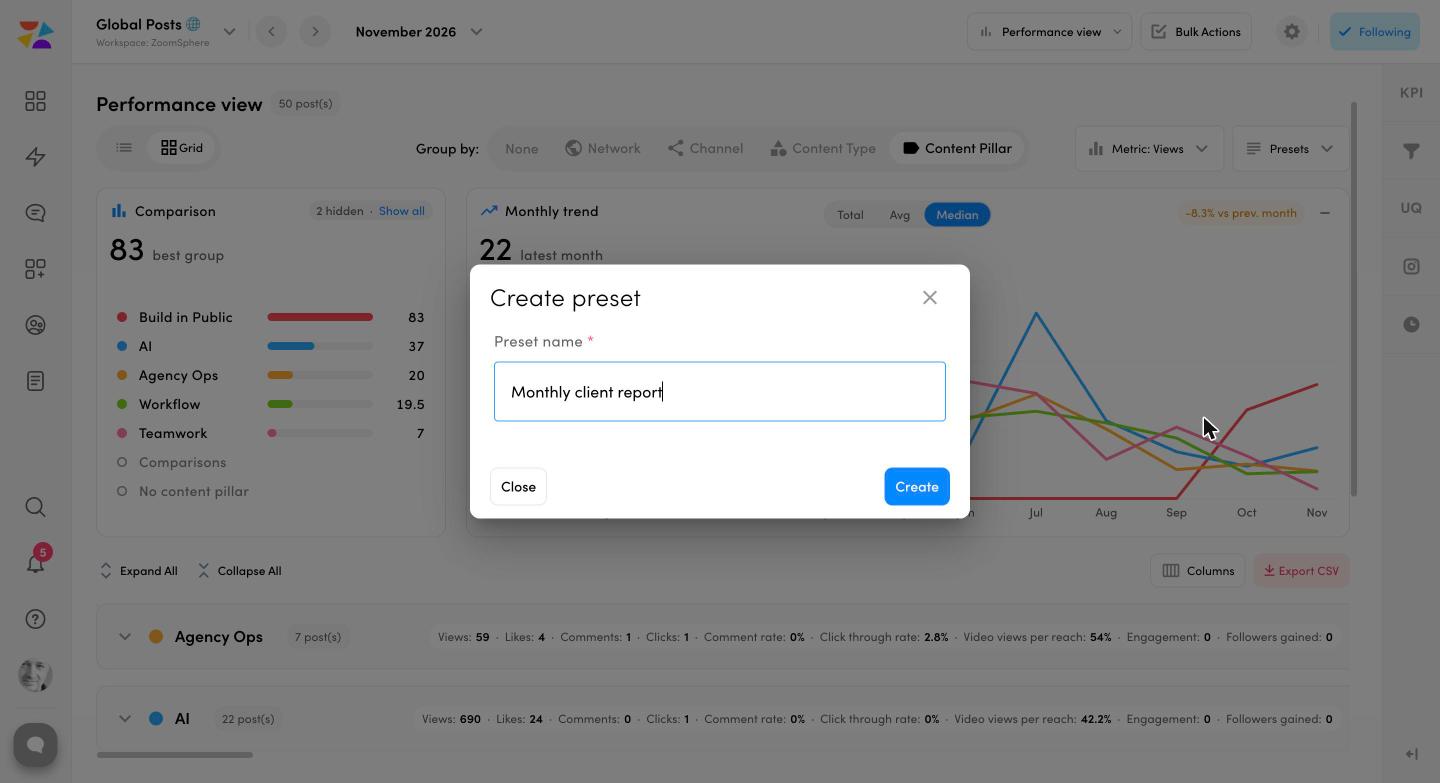
Name your preset once, reuse it every month.
Three recipes to try today
1. Which content pillar really works?
Group by Content Pillar, metric Views or Reach.
Read Share of Total to see where the attention comes from.
Flip to Median and check the Comparison: which pillar wins per post?
Switch the metric to Interactions or Shares and see if the winner holds.
2. A monthly client report in five minutes
Open the client's scheduler in Performance view and switch to Grid.
Group by Network and load your Monthly client report preset.
Read the Total row of each network and the trend chart for the story of the month.
Hit Export CSV, or hand the same breakdown to Claude or ChatGPT through ZoomSphere MCP for a branded report.
3. Which format should we make more of?
Group by Content Type and set the mode to Avg or Median.
Load the Reels / video preset to see watch time and replays next to every Reel.
Compare formats on the metric that matches your goal and shift next month's plan accordingly.
Find out what really works
Open Performance view in any of your ZoomSphere schedulers, group by Content Pillar and flip to Median. It takes two clicks.
Open Performance viewFAQ
Where do I find the new charts?
In any ZoomSphere scheduler, click the view switch in the top right corner and pick Performance view. The charts sit above the post table in both List and Grid view.
Which metrics can I chart?
Views, Video Views, Reach, Interactions, Likes, Comments, Shares and Clicks.
What can I group by?
Content Pillar, Network, Channel and Content Type, or None for all posts together.
What is the difference between Avg and Median?
Avg is the total divided by the number of posts, so one viral post pulls it up. Median is the middle post, which shows what a typical post in the group does.
Can I save my own column set?
Yes. Choose your columns and click Create Preset in the Presets menu, or start from the suggested Overview, Reels / video, Stories and Posts presets.
Will my settings stay when I come back?
Yes. Grouping, metric, Total, Avg or Median, hidden groups and the folded or open chart panel are remembered.
Why is the current month lower than the last one?
The current month only counts posts published so far. Compare finished months for a fair read.










Recommended for you