


The Frequency Formula: How Often Brands Should Really Post on Social Media
%20(1).webp)
.webp)
Here’s a sneak peek from The Frequency Formula. Download the full report to explore the complete data and discover how often brands should post on Social Media in 2025.
How often should brands really be posting on social media?
It is the question every marketer asks, and until now the answers have mostly been guesses, opinions, or vague best practices.
So we decided to measure it.
We analyzed posting frequency across more than 25,000 social media profiles to understand how cadence affects engagement, reach, and impressions. The results reveal clear patterns, a few surprises, and one important message. Posting more is not always better, but posting smarter always is.
This article is a preview of the findings.
To see all charts, platform insights, and expert commentary, download the full Frequency Formula report.
How We Measured the Data
To understand how posting frequency influences performance, we reviewed activity from more than 25,000 social media profiles across Instagram, Facebook, TikTok, and LinkedIn. We looked at the number of posts each profile published within a 35-day period and calculated the average weekly posting frequency for every account.
Each post was then analyzed for engagement rate, reach, and impressions. Engagement rate was calculated as total interactions divided by reach. Every post was treated equally to avoid giving larger profiles an advantage.
With this approach we were able to compare how different posting levels influence performance and to see the patterns that separate low volume, medium volume, and high volume publishers.
Platform Highlights
Instagram shows a clear pattern. Posting more often increases visibility, but it does not guarantee stronger engagement. The best engagement comes from brands that post with intention, not volume.
Engagement Rate
Engagement rate peaks at one or two posts per week. This suggests that audiences respond best to focused, high-quality content rather than a constant stream of updates. As posting volume rises, engagement becomes more volatile and only improves again for the most active, established profiles. This reinforces the idea that quality and consistency matter more than output.
The full report includes all reach and impression curves for Instagram and a detailed breakdown of how visibility changes with every posting group.
%20(1).webp)
Facebook behaves differently from Instagram. Posting more often does not dramatically change engagement, but it does have a clear effect on visibility. The platform rewards consistency, not volume for the sake of volume.
Engagement Rate
Engagement rate on Facebook stays relatively steady across most posting levels. The only noticeable lift appears around eight to ten posts per week, where audiences seem more likely to interact. This suggests that bursts of activity can draw more attention than maintaining the exact same rhythm every week.
.webp)
Reach
On Facebook, reach doesn’t rise in a straight line as posting frequency increases. Moderate posting around 3–4 times per week performs better than very low or mid-range activity, but the biggest jump happens only when profiles post more than 10 times per week. More posts give Facebook more opportunities to surface your content, which expands visibility even if engagement stays stable.
The full report includes Facebook impressions, plus a deeper comparison between reach and engagement across every frequency group.
%20(1).webp)
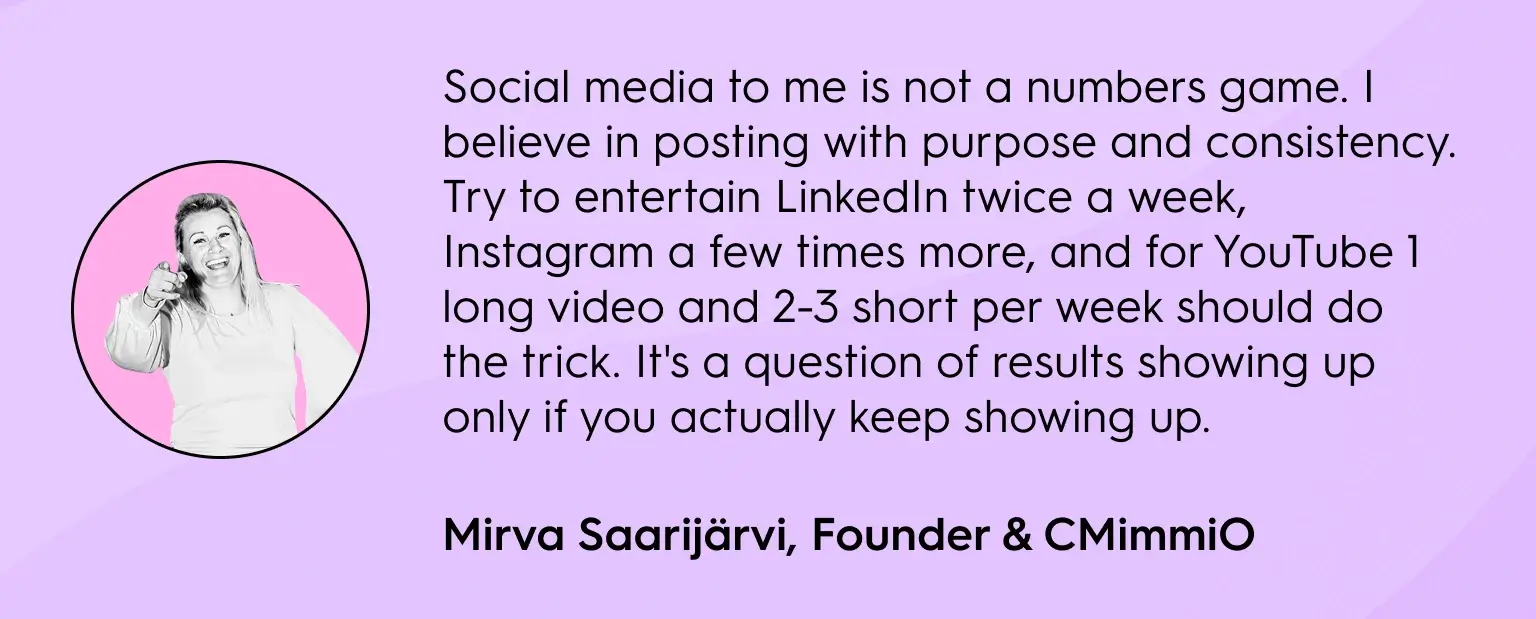
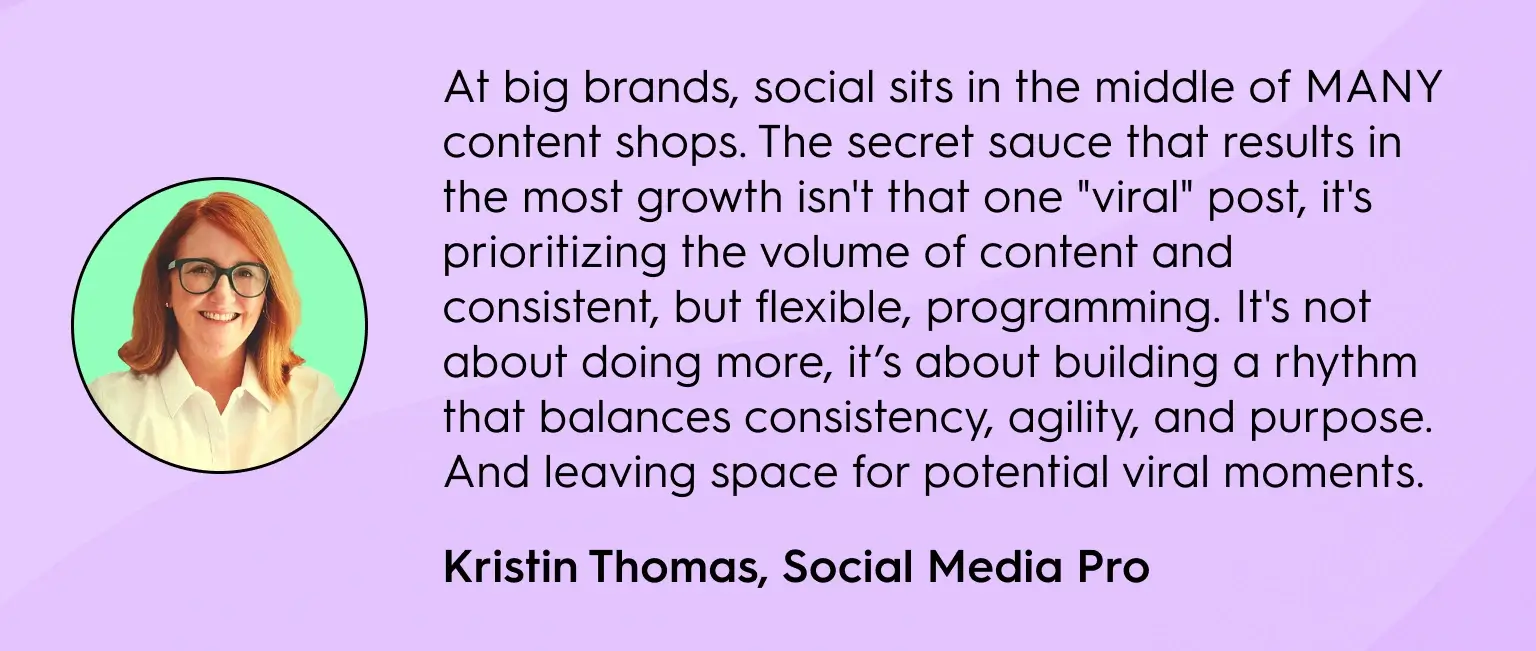
Expert Quotes
To help interpret the data beyond the numbers, we invited some of today’s sharpest social media minds to weigh in on posting cadence, platform behavior, and how brands should think about consistency in 2025. Here are two insights pulled directly from the full report.
%20(1).webp)
Conclusion: What All This Means for Marketers
If there’s one thing our data makes clear, it’s that posting frequency isn’t about doing more. It’s about showing up with intention. Brands that succeed aren’t the loudest, but the ones that maintain a rhythm their audience can rely on.
Consistency is the real competitive advantage. Posting often doesn’t automatically boost engagement, but a steady cadence builds the momentum that platforms reward over time.
Quality still decides the outcome. Audiences respond to content that solves problems, entertains, inspires, or teaches. Creativity and clarity outperform volume every single time.
Your schedule has to be sustainable. Teams burn out long before algorithms do, so the best posting frequency is the one your workflow can support without sacrificing relevance or creativity.
Across platforms, rhythm always wins. Whether it’s Facebook, Instagram, TikTok, or LinkedIn, the profiles with the strongest visibility are the ones that show up regularly, not randomly.
%20(1).webp)
Get the Full Report
This article is only a preview. The full Frequency Formula: How Often Brands Should Really Post on Social Media report includes:
- Complete data breakdowns for Instagram, Facebook, LinkedIn, and TikTok.
- Engagement rate, reach, and impression charts across all posting frequencies.
- Expert insights and commentary from leading social media professionals.
- Practical takeaways you can apply to your content strategy immediately.


Recommended for you
%20(1).webp)
.webp)